 A couple of weeks ago, we discussed the Preparation phase of the Data Lifecycle.
It was the first in a series of three posts (and webinars!) discussing how you can make better use of data, how to think about managing data, how to think about processing it, and the cycle that you should go through with your data to make it more useful.
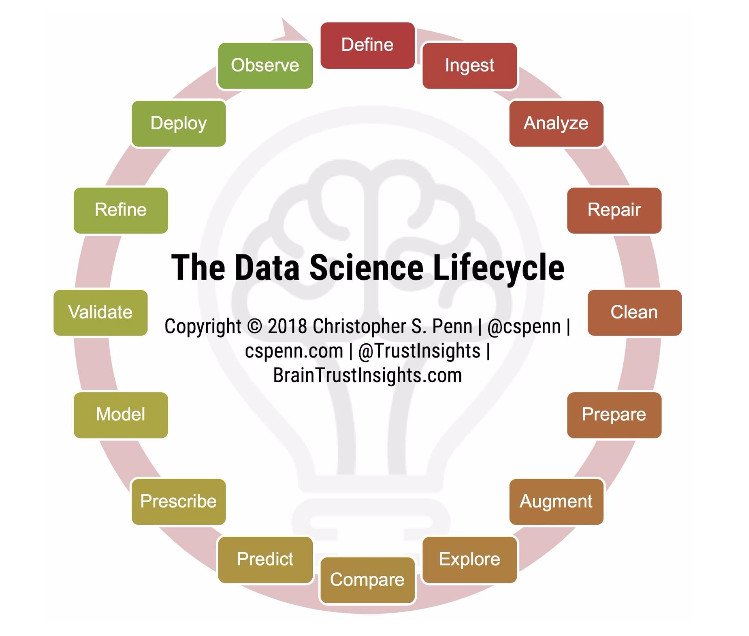
This week, we’ll cover the Exploration phase, which addresses the Explore to Predict stages of the Data Lifecycle.
Data Lifecycle: Next Steps
So, based on our discussion last time, let’s assume that we’ve done a great job of getting everything that we want to know into one gigantic spreadsheet (Preparation!).
Great. What’s the next step?
The next step is to explore the state of the data. To figure out what’s in here.
This is actually a separate discipline within a subdiscipline called exploratory data analysis.
And there are a number of software packages that actually do this.
There’s one called Smart EDA that I use within the R programming language.
There are off-the-shelf solutions.
There are SAS solutions, like IBM Watson Analytics, that can do a lot of the exploration for you.
And what you’re doing is figuring out what is the data, what’s in the data? What things can we learn about it?
So, let’s look at basics statistics.
Data Lifecycle: Explore
If you have a numerical column in your data, say, like the number of retweets, for example.
What was the minimum and maximum? The median? What was the average, or the mean? What’s the one standard deviation?
You are starting to do mathematics on the data—on any quantifiable data—to see, okay, what’s in here from an information perspective that we can make use of?
It would be good to know, for example, the maximum number of retweets that your client had versus their competitor.
It would be good to know that March is a better month for your client’s Facebook posts than May.
This is what you do in the exploration phase.
You may not necessarily be tackling the questions you set up when you defined your goals to begin with. Right now, you’re just trying to get a lay of the land in the data set itself.
Data Lifecycle: Compare
The next step is to compare. Perhaps you’re taking the data and comparing it to other parts of the data set.
Or, you may be comparing it to those augmented sources, depending on how you’ve structured your data.
But those comparisons and understanding what’s going on period over period, for example, is very, very important.
And that comparative process is a part that a lot of public relations practitioners leave out of their data lifecycle.
One of the things that I remember back in my agency days: I would see reports going out to clients, stating things like: “Oh, this is what happened this month.”
The client would come back and say, “This has no context. Is this better or worse than last month?”
So there’s a time-based comparison.
Or they would say, “what’s happening with XYZ competitor?”
It’s a qualitative comparison.
So “comparison” is an essential part of the process to help give/provide context to your data.
Data Lifecycle: Predict
The next stage in the data lifecycle is prediction.
This is where we start to look at the data and forecast it forward.
There are two types of prediction you can use.
You’ll be doing either what’s called driver analysis or time series forecasting.
Driver analysis says: Here’s a KPI that we care about. What causes it? What has a high mathematical relationship to that factor?
So let’s say we’ve got all of our data in one big spreadsheet.
In one column, there is a number of leads generated; maybe it’s a B2B example or an e-commerce example, like the number of shopping carts filled.
Perhaps you could look at the number of people who walked in the storefront for a B2C brick and mortar operation.
That number is super important. If we have our data laid out in this big table, we can ask “Okay, what metrics leading up to that have a high mathematical correlation to the outcome?”
For storefront visitors, maybe it’s the number of people who visited the driving directions page on our website, or maybe it’s the number of Instagram posts that somebody liked or commented on.
What we want to do with driver analysis as a form of prediction is to develop that mathematical model.
Forecasting
The second one is time series forecasting.
So, let’s focus on storefront visits.
Say we have five years of the number of people walked in the front of our store or fill out a form on our website, or whatever the KPI is, you’d want to use time series forecasting to figure out okay, what’s likely to happen in the next 30 days, or six months, or a year?
Depending on how much data you have to work with, you may be able to forecast that forward and make a prediction.
Okay, it’s August 2018, and we’re collecting data. What’s going to happen in October 2018?
Hypothetically, let’s say I am reporting on the women’s footwear industry. I’m forecasting for the exact week that the retail shopper is going to go out and say, “This is the week we’re going to buy gold colored pumps.”
But that forecasting is a form of prediction that helps understand that “this” is what’s likely to happen.
So, we’ve explored and compared our data and provided some context.
We’ve done our look backward at our data.
Next, we want to look forward. We’ll discuss using driver analysis to help us understand what drives those KPIs, or time series forecasting to understand when a KPI is going to occur next. We’ll use that to predict!
Up Next: Production
We’ll stop here for now. It’s a lot, right? So far, we’ve covered the “Preparation” and “Exploration” stages of the data lifecycle.
Up next? Production!
That’s where we figure out how to put everything we’ve figured out into action. Are you excited? I am!
Note: We have also packaged this Data Lifecycle for Communicators into a series of webinars.
Webinar: Part 2 of the Data Lifecycle for Communicators
If you have questions, I look forward to addressing them. Please feel free to ask below in the comments, or join the Spin Sucks Community and connect with me there.
Also, if you want help with your company’s data and analytics, visit Trust Insights and let us know how we can help you.