 On Tuesday, we spent some time going through the correct PR metrics to track.
Yesterday, we talked about how to effectively measure PR through benchmarks and failures.
Today—in the last part of our series—we’ll get through how to measure PR that translates to real cash.
Get your brain ready because, if it hasn’t exploded yet this week, my goal is to make it happen by the time you finish reading this blog post.
PR Definitely Should Drive Revenue
A few years ago, I was kicked out of a LinkedIn group.
I was (gasp!) advocating that we can measure PR with real business results.
The moderator of the group sent me a note and said I’m akin to a snake oil salesman; that one can measure PR only through brand awareness.
His view is that anyone who advocates PR drive revenue is doing the entire industry a disservice.
He kindly asked me to leave.
At first, my feelings were hurt, but now I wear that with a great badge of honor.
PR absolutely can, and should, drive revenue for an organization.
Let me give you an example.
We have a client we’ve been working with for six years, and it is not the sexiest business in the world.
They make the lining in cars that insulates the sound inside so you can hear yourself talk or what’s on the radio. It also keeps the outside noise, well, outside.
So you can imagine it’s not the easiest business to promote.
But, because everything we do drives back to revenue, we’ve had a really big effect on their bottom line.
We’ve also helped them reach new audiences.
And, because they actually let us do our jobs, I love working with them.
A Non-Sexy, But Effective Example
Last year, they opened a plant in the Cincinnati area.
It took more than a year, from groundbreaking to opening so we had several touch points with local media.
We went through a few phases with our content efforts, including pitching interviews, contributed content on third-party sites, and ghost writing content for the CEO on their company’s blog.
We worked on content around their negotiations with the city, their groundbreaking for the new facility, their hiring in advance of the grand opening, and their ribbon-cutting ceremony.
This is not sexy content by any stretch of the imagination, but it was very, very effective for them.
To begin to track results for them, we started with Google Analytics and its referring websites data to generate this spreadsheet for our client.
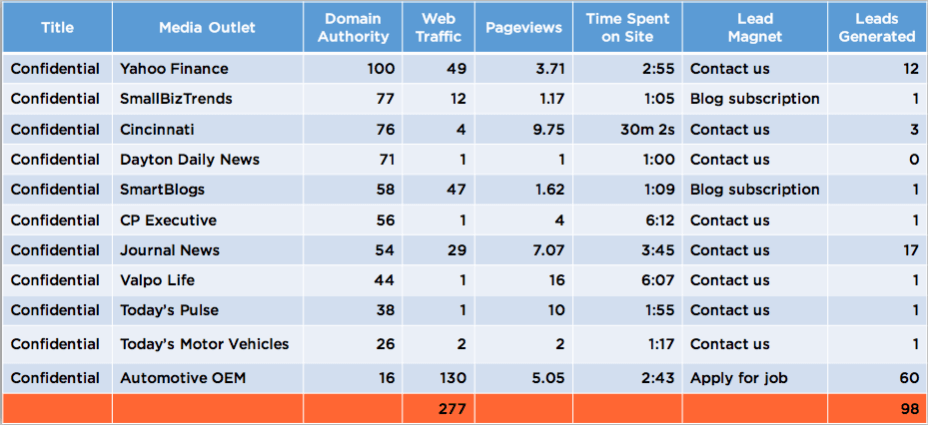
As I scan this list, I see a piece of contributed content in SmartBlogs.
Their domain authority is 58, which is higher than the company’s blog.
That piece sent 47 visitors to the company blog, who spent an average of one minute and nine seconds on the site.
The call-to-action on that piece was to subscribe to the blog, and you can see that the piece generated one blog subscription.
One subscription from 47 visitors isn’t a great conversion rate.
I’d definitely want to see that go higher, but it’s a good start.
As we dig further, you can see we had a 35 percent conversion rate.
We brought in 277 new visitors to the site with 98 leads generated, which means people who did something on the site such as applying for a job, subscribing to the blog, or contacting the company through their contact form.
Now, remember, this is a B2B manufacturing company so 98 leads in six months is significant.
Measure PR Against Cold, Hard Cash
So how do I get a more concrete ROI dollar amount?
Some of us are lucky enough to have a well-constructed reporting system that can tell you exactly how much every tactic generates in revenue.
For the rest of us, I have a bit of a hack.
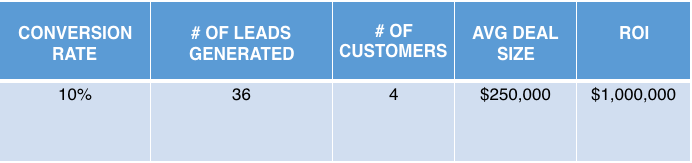
Using this same client as an example, we know, on average, 10 percent of their qualified leads turn into customers.
Using the dashboard above, there are 36 people who filled out their contact us form.
At 10 percent conversion, that’s 3.6 (we can round it up to four) new customers.
And, if their typical customer generates $250,000 per year in revenue, that means our efforts can be attributed to $1,000,000 of revenue, which is a pretty great return on their monthly PR retainer investment.
Tips, Tools, Templates
Did I make your head explode?
I mean, I know it’s math toward the end here, but it’s simple multiplication that you can make your spreadsheet—or a calculator—do for you.
The rest of it is data you can pull directly from Google Analytics.
But, to make things super easy on you, we have a package of how to measure PR templates and resources.
Go download them and let me know what questions you have!