 The PR industry has a bad rap—and we get no respect.
The challenge is that, for the most part, what we do:
- Is not trackable.
- PR pros have a terrible reputation problem with journalists.
- You can’t scale it.
- There is no use putting lipstick on a pig.
Sound about right, based on your experience?
The good news is it doesn’t have to be that way, but we do have to make some changes—both in the work we do every day and as an industry.
Media Impressions and AVEs?
Too often, we continue to fall back on media impressions and AVEs, even though we know they don’t mean much.
They’re comfortable, they give us something to report on, and executives have come to accept them as our metric.
But in a world full of data both to help us make decisions and measure results, we have to step outside of our comfort zones and start reporting on the things that matter, not made up metrics.
For every communicator outside of the U.S., media impressions and AVEs are not only passé, they are fined for using them in their PR metrics reporting.
Last year, AMEC announced they are going to invest “significant time and resource to finally kill off this derided metric.”
In a paper published on the topic, among the requirements of AMEC members includes:
- All AMEC members to sign an undertaking that they will not provide AVEs by default to any client. Any client that requests AVE as a metric will receive standard educational material explaining why the metric is invalid and should not be used. They will be offered alternative PR metrics instead.
- Working with PR Award organizers around the world to introduce a zero-scoring policy if awards entries include AVEs as a metric. AMEC members will not provide an AVE as a metric for any award competition entry.
- Working closely with academics and PR practitioners to help them help AMEC kill off the demand for the metric which is sustaining it currently.
In direct response to AMEC, the Chartered Institute of Public Relations took it a step further and said any member using AVEs will be banned from the organization.
The new guidelines were presented to the CIPR Council last September, providing members one year to complete a transition to valid PR metrics.
If, after that time communicators are still found to be using AVEs, they “may be liable to disciplinary action.”
But Here in the U.S.?
When we judge award entries for the professional organizations, we find the results section to be lacking real business results. They’re focused, instead, on Facebook fans, number of media interviews, and media impressions.
It hurts my analytical brain. It hurts my communications heart.
PR pros win big awards for measuring their efforts that way so why should it change? It turns out, we can’t have our cake and eat it too. Either we can win the big awards and display them in fancy cases in our lobbies. Or we can have a seat at the table, and learn how to take advantage of the web to track against the real things that sustain a business.
Things such as increased revenue, shortened sales cycles, and improved margins.
Vanity and Data-Driven PR Metrics
But, here’s the thing: I’m not so numbers driven I don’t recognize the need for vanity PR metrics.
It is very difficult to measure brand awareness and the effectiveness of traditional PR—both very necessary in brand building and reputation and consensus and community.
Because of that, we have to find ways to measure results in ways that are meaningful to the executives paying us.
I’ve broken down the types of things you can measure by vanity (brand awareness) and data-driven (business objectives) PR metrics.
Vanity Metric: Media Relations
Media relations doesn’t mean just working with journalists; it also includes blogger and influencer relations. Because of the web, we no longer have to count on circulation multiplied by two and a half if it’s a consumer publication. Or multiply circulation by five if it’s a trade outlet.
Now you can track how many times an article, blog post, or piece of content was shared. You can figure out how many people saw it, shared it, and read it. Get to know Google Analytics (really, it’s non-negotiable) and track the traffic, views, and social shares.
Report to your executives the value of each campaign.
Vanity Metric: Customer Relations
We have a huge opportunity to build one-on-one relationships with our customers via the web.
Social media provides the opportunity to connect, engage, and chat. In this case, fans, friends, connections, followers, and viewers make sense to track…when combined with the data-driven metrics.
Vanity Metric: Scaleability
One of the challenges of the industry is that PR can’t scale.
That was true in the olden days—even just five years ago. Today though? PR pros are being tasked with boosted posts, promoted tweets, and Outbrain.
In the past, because these things would be considered paid media, they would have lived under the advertising roof. But I’m willing to bet, like us, more and more of you are spending time with these tools. Facebook, Twitter, and Outbrain all give you analytics to support your social media buys.
Data Metric: Big Data
For those of you who have been in the industry for a few years, you’ll remember having to sit through focus groups night after night, watching people on the other side of one-sided glass talk about your products or services.
I was always happy when the advertising team said we didn’t need to attend. They were so boooooring.
The beauty with Big Data is we no longer have to give up our weeknights (and eat pizza four nights in a row) to get information about what our customers think. If you have strong command of all of the data at your fingertips, you will be able to influence high level decisions on product, market positioning, and more. If you don’t know how to sift through the data, look at taking some online courses through Coursera or Cognitive Class.
Data Metric: Shortened Sales Cycle
If you’re in a consumer business, this is less important to you. But in a B2B organization, a sales cycle could be anywhere from two days to two years. Work with your sales team to figure out how long the average sale takes and set a goal to beat it.
Let’s say it takes 10 months..set your goal to nine months. The best way to shorten a sales cycle? Stay top-of-mind. The best way to stay top-of-mind? Create valuable and interesting content that is shared in the places your prospects hang out.
This could include email, social media, stadiums, subways, websites, and more. The better your content, the more likely your prospects are to read it. The more likely they are to read it (or view it or listen to it), the more likely they are to buy from you.
PR pros have ultimate control of this.
Data Metric: Improved Margins
We had a client a few years ago who incentivized us based on how much we helped his margins increased. Just as we were about to get our bonus for an improving their margins by two percent, he decided to buy a Ferrari. That killed the margins and we got no bonus.
(I also learned a very valuable lesson.)
If you don’t work for a public organization, I recommend staying away from this one. If you do, however, the easiest way to determine your affect on margins is to track how much revenue you generated. Then subtract your budget, your salary, and your benefits (if you work for a PR firm, subtract your budget). The number you end up with is the revenue you’ll use for reporting. Then you’ll have your finance team help you figure out the margins from there.
If you increased revenue by more than what you spent, you can pretty much guarantee you improved margins, too.
Data Metric: Increased Revenue
If you don’t work for a public company, having access to the revenue goals may prove a little difficult. But, if your organization is run like mine, the revenue goals are very visible.
Figure out how you can affect growth. If you have ecommerce, your campaigns will drive to landing pages where people can buy. If you don’t sell online, your content, email, social media, media relations, and other efforts will be measured through the leads you generate, how you nurture them, and how you help sales convert them.
Gain access to the CRM so you know exactly where each lead comes from and whether or not they convert. You have to have access to software the organization so you can track your efforts.
That is how you know how much money you’re driving for the business.
Hit These Two Metrics Out of the Park
Now that you have an idea of what to measure for both brand awareness and sales, it’s time to dig into how you will use that information to prove your own worth.
During the earned media section of this series, you created your benchmarks, so you already know where you started. Now it’s time to measure results!
At a high level, your metrics are going to be as simple as:
- Your domain authority has increased; and
- You’re ranking on the first page of Google for your topic.
If you hit these two out of the park, everyone will be happy. When people search for your keywords, you’re there. When people are looking for a solution that your organization solves, they find you.
They see you on the first page of Google results, they click on your amazingly compelling headline, they visit your site, they fill out a lead form, they go through your lead nurture process, and they become a customer.
Hooray!
A B2B Example
But domain authority and search results are just the beginning of how to measure results. Ideally, you want to show a conversion from website visitor to customer.
Let me give you an example.
We have a client that is a business-to-business manufacturing organization. It’s not a super sexy business, but we’ve been able to have a tremendous effect on their bottom line and help them reach new audiences through contributed content. And I love them for that reason.
We worked with Cincinnati media outlets for more than a year, in support of a new facility they opened there. We had a few phases, including pitching interviews, contributed content on third-party sites, and ghostwriting content for the CEO on the company’s blog.
The PESO model campaign was around:
- Their negotiations with the city
- The groundbreaking for the new facility
- Hiring in advance of the grand opening
- The ribbon-cutting ceremony
This is not exciting content by any stretch of the imagination, but it was very, very useful for them.
Measure Results of Owned and Earned Media
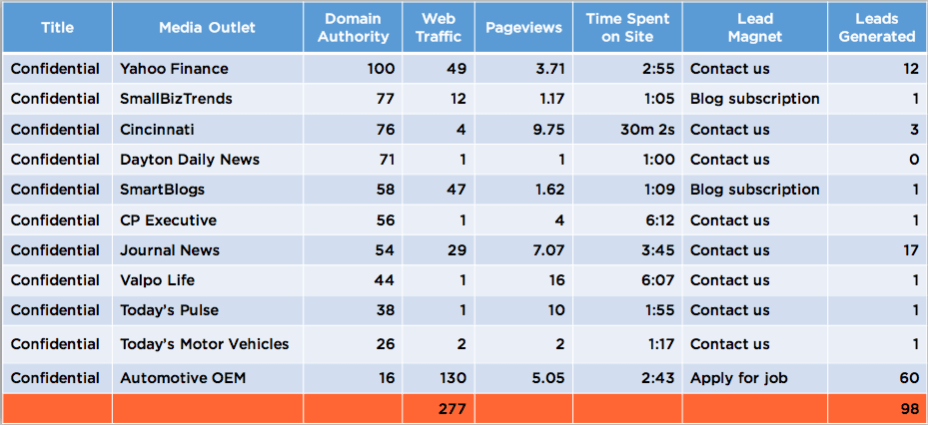
To track results, I created a quick spreadsheet, listing all of the places the client was mentioned during the plant launch and opening. Quickly scanning the list, I can see the SmartBlogs entry was a piece of contributed content from the CEO.
Their domain authority is 58, which is higher than the company’s blog. That piece sent 47 visitors, who spent an average of one minute and nine seconds on the site. The call-to-action on that piece was to subscribe to the blog, and you can see that the piece generated one blog subscription.
One subscription from 47 visitors isn’t a great conversion rate, but it gives us something to use in our second piece of contributed content.
As you can see, the more content we produced, the better the conversion rate. We had about a 35 percent conversion rate and return-on-investment for our contributed content, bringing 277 new visitors to the site with 98 leads generated.
This means people did something on the site such as apply for a job, subscribe to the blog, or contact the company through their contact form.
What to Track When You Measure Results
This is how you start to measure results. You track all the places you are placing content, and the resulting traffic to your website, and the conversion of those from visitors to potential clients.
You want to track activities such as:
- Subscribing to your newsletter
- Downloading a white paper
- Watching a video
- Registering for a webinar
- Submitting a job application
- Any other call-to-action you are using on your website
This can be any action that you can track. You’ll note we stopped at the point the visitor is converting into a lead.
With this particular client, moving a lead into a closed sale is the job of the sales team, which is pretty typical.
But if you can prove a new customer began with your work, you’ve won.
Of those 60 people who applied for jobs with our client, we don’t know how many of them were offered a job. What we do know is 10 percent of their qualified leads turn into customers. We can use that on our end to measure results and show a return-on-investment.
Why Links in Articles Are Important
If there were 30 customer leads, 10 percent conversion is three customers. And, if their typical customer generates $250,000 per year in revenue, that means our efforts can be attributed to $750,000 of revenue, which is a pretty great return on their monthly PR retainer investment.
Of course, this is only directional, but it’s a start at showing the direct business value of the work we’re doing.
Let’s dig into how you get these numbers. Here’s an example of one of the articles in the Cincinnati Enquirer.
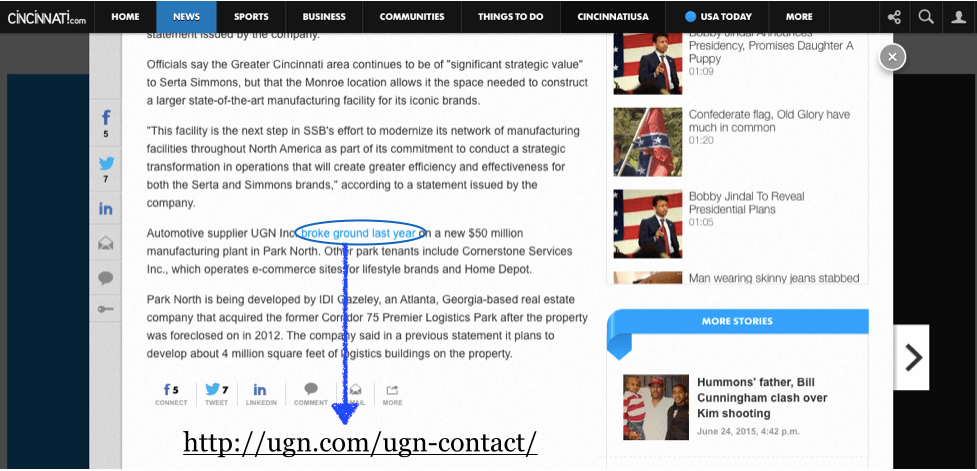
The anchor text you see here in blue was linked directly to the company’s contact form. We specifically chose to use “broke ground last year” as our anchor copy because we knew people would be searching for plants in Ohio that had recently broken ground if they were looking for a job in manufacturing. And, because our objective was driving job applicants, that’s who we wanted to attract.
Here’s the form that the site linked to.

As you can see it’s pretty simple and doesn’t ask for a ton of information. It just acts as a conduit for communicating with the company from their website. Submitting this form is the call-to-action.
A SaaS Example
As you start placing contributed content and seeding it with your trackable links to your website, you can begin to measure results.
This example is data from a different client. I have removed incriminating information, so you can see an example of real results without breaking their confidentiality.
In the tracker, we log:
- The date of the article
- The title
- The publication name
- Their domain authority
- How many visitors the piece sent to the website
- How many pages they viewed per session
- The amount of time they spent on the website.
You can track this data manually in a simple spreadsheet, or you can move into a more sophisticated automated tool. We like DashMetrics, Domo, Geckoboard, or Raven SEO tools.
Steps to Measure Results from Analytics
To get the data you need to populate this tracker, log into Google analytics.
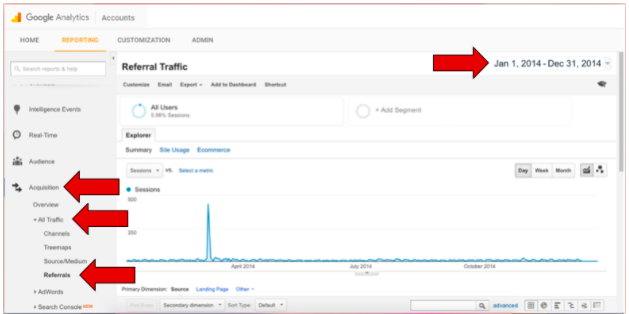
Choose the desired date range at the top of the page— I chose Jan 1, 2014-December 31, 2014 because that’s when we started working with the SaaS client above. Then click on Acquisition in the left-hand navigation to expand that menu, then on All Traffic, and then on Referrals.
This will bring up a search bar. In this search bar, input each of the domain names for the publications where you’ve placed articles and search for them.
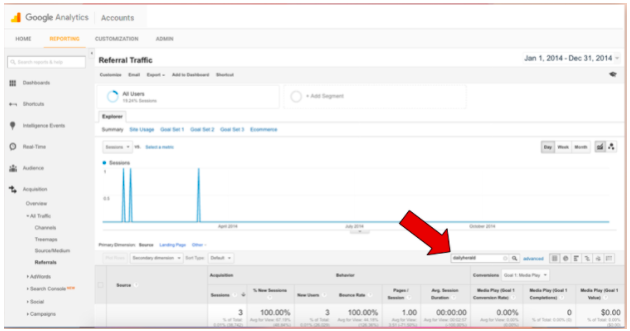
For example, for the Chicago Daily Herald piece we placed, I’m going to type in “dailyherald” and hit the search icon to return the data on the referrals from that domain.
It’s important to make sure to use the media outlet’s URL and not their name.
Google Analytics tracks the referring URLs and not the names of the websites that refer traffic to you.
Make Better Recommendations
When I hit return on my dailyherald search, here’s what I see.
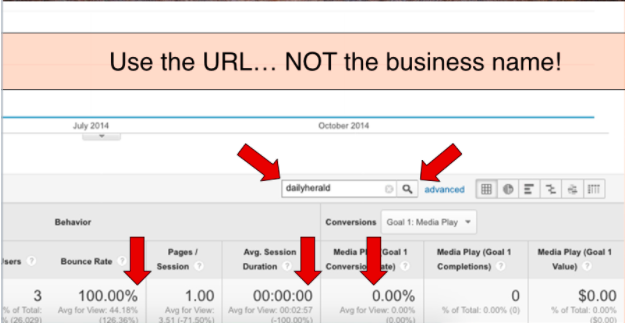
In 2014, the Daily Herald website sent this website three visitors, all of them new users, but the bounce rate was 100 percent. That means that every one of the visitors came to the site, didn’t find what they were looking for or didn’t find the content interesting enough, and left without viewing any other pages on the website.
In this case, it’s not a good return-on-investment. The lesson here is, although the client was interested in local publications, and that’s where we worked to get placements, those stories—here and with Crains and the NBC Chicago affiliate—did not generate website visitors.
These placements might make the client feel good when their friends and family excitedly tell them they saw the mention, but it’s not doing anything for them—it’s not driving business results.
That means it’s time to consider revising this strategy. With the data in front of us, it’s easy to recommend focusing on KMWorld, VentureBeat, Forbes, CMSwire, and TechCrunch.
In this example, we have the publication name, the number of visitors, the number of conversions, and the revenue generated by those conversions.
Back into the Conversion, if Need Be
For this client, their conversion rate is 1.35 percent. Using Forbes as the example, we take the number of visitors, 209, multiplied by 1.35 percent, which would give us three as our number of conversions.
Next, we take the number of conversions, three, multiplied by the typical revenue per conversion, which is about $21.39, which gives us revenue of $64.18 for that Fortune placement.
TechCrunch sent more than 10,000 visitors to the site and accounts for about half of all the revenue generated for the year from these placements. That context makes it pretty easy to decide where to double-up your efforts. It also gives you the ability to show that your efforts are directly responsible for generating revenue—it’s not just an expense.
While $7,000 in revenue doesn’t pay for all the time you spent on communications for the year, it’s better than $0, and it gives you a starting point to measure results.
Many tech vendors call this PR attribution—check out what both AirPR and TrendKite are doing around this.
It’s time to gain proper credit where it is due.
Watch our FREE masterclass and learn how to implement the PESO model to achieve unparalleled communications results.
Watch PESO 2.0 Masterclass NOW
Do you want to learn how to build and scale an integrated communications program? One which drives real business results and shows the PR value clients care about? Become PESO Model Certified today.
Learn More About PESO Certification
Photo by Charles Deluvio ???? on Unsplash