 By Roger Dooley
If you create content, you have a content credibility problem.
A study by Vibrant Media showed that only 33 percent of people trust branded content, only slightly worse than the 35 percent trust factor for editorial content.
The analysts viewed this data as good news for branded content because it was trusted at just about the same level as editorial content.
For me, the real story is that two-thirds of the respondents apparently don’t trust either kind of content.
But, there’s still hope if you want to boost your content credibility. Specifically, there’s scientific research that shows you can make your content more believable to your readers with some simple changes.
Include a Chart or Graph
Cornell researchers showed subjects different versions of advertising material for a medication.
Some saw it as text only, and others saw the same information accompanied by a chart.
When the data was presented by text alone, 68 percent of readers found the claims credible.
When a chart similar to the one below was included with the text, 97 percent of the readers believed the claims.
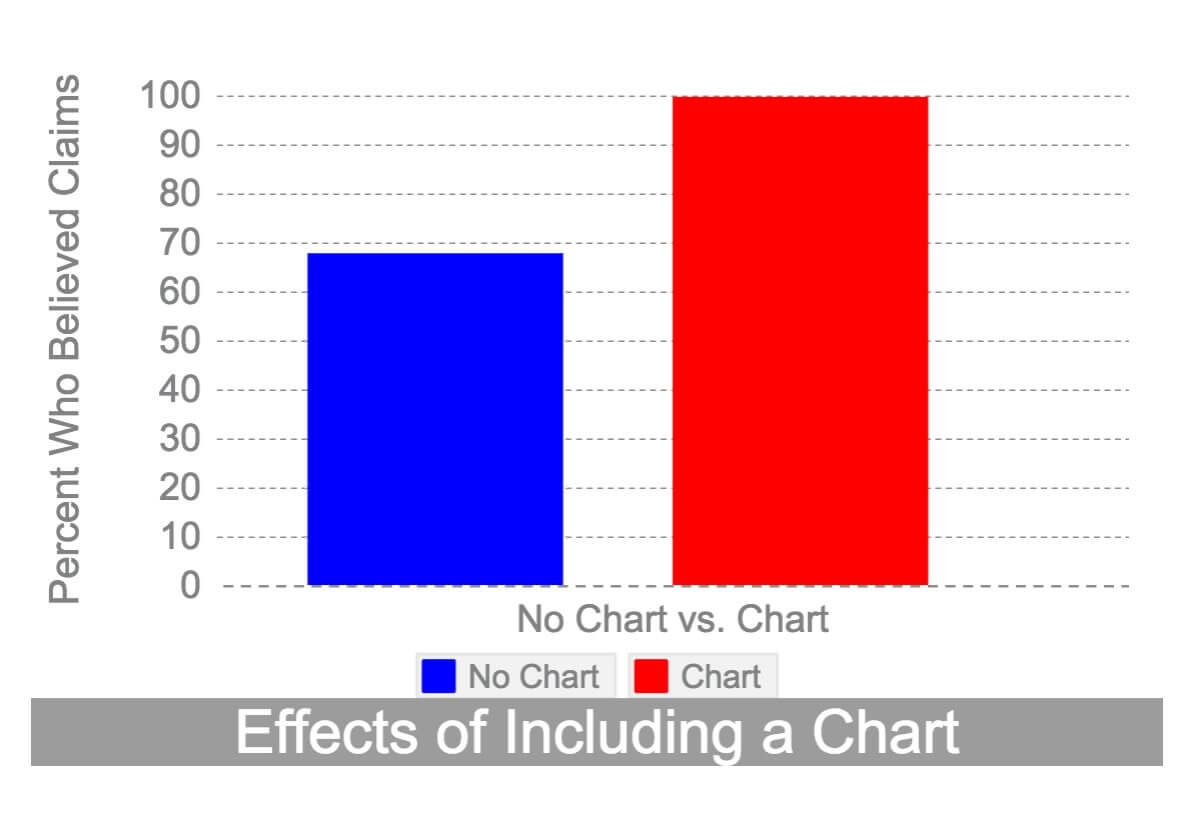
The chart converted just about all of the doubters into believers.
Many different kinds of information can be used to produce a chart.
The experimenters didn’t specifically compare types of graphs and charts, but their general conclusion was that it was the scientific appearance of a chart that caused the effect.
If that’s the case, then a chart that is more scientific-looking with gridlines, scattered data, or error bands would be more convincing than a polished infographic visual representation.
Include a Formula
As part of the same set of experiments, the Cornell researchers also presented information with and without a chemical formula.
In that case, subjects who saw the content describing a medication in text form only estimated that it would work for four hours.
When a formula was added to the same text, the expected time for the medicine to keep working went up to six hours—an astonishing 57 percent increase.

Once again, subjects who saw the formula and predicted longer-lasting effects apparently did so because of the scientific appearance.
It’s highly unlikely that any of the subjects had the slightest clue as to what the chemical formula represented and how it might relate to drug performance.
Include ANY Scientific Information or Imagery
I’m not suggesting that you increase content credibility by including irrelevant or meaningless information, but that’s essentially what Yale researchers did to see how it would influence readers.
The scientists found that non-expert readers considered an explanation of a psychology topic to be more satisfying when irrelevant neuroscience data was included.
Similarly, other research showed that articles about neuroscience were judged to be more believable when brain scan images were included.
That was true even though the images did not directly support the conclusion of the article.
Even neuroscientists are concerned that professional journals find papers with colorful brain images more compelling, even though the images add little or nothing to the value of the content.
And, while more recent research suggests that the brain image bias may be in decline, that may be very specific to the increasing familiarity of brain scan (as opposed to general science) imagery.
Weird Science?
The key takeaway from these and other studies is that science increases the content credibility.
(Indeed, would you find this post as credible without the science to back up the points?)
Studies repeatedly show that it’s the appearance of scientific support that sways most readers into finding content credibility.
That doesn’t mean that you should include bogus or irrelevant science to dupe your readers. Rather, you should find creative ways to express your points that appeal to your readers’ unconscious preference for scientific justification.
For example, if you are describing a new product that is 33 percent more effective, or 25 percent less expensive, than the old product it’s replacing, include a simple bar graph that visually illustrates the difference.
Or, if you can logically include a formula, an equation, or any other kind of scientific imagery, do it.
Beyond Content Credibility
There’s a practical side to leavening your text with charts, graphs, formulas, and images.
These images can be used when sharing content via social channels.
When I spoke to author Guy Kawasaki a few months ago, he offered anecdotal proof of the power of images.
Last December, he began adding an image to every tweet. When he compared before and after data, Guy found that engagement with those posts doubled.
And, there’s hard data to support Guy’s experience.
Social media data cruncher Dan Zarrella analyzed hundreds of thousands of tweets and discovered that pictures in tweets increased shares by 94 percent.
Perhaps because he’s seen the same research I described above, Dan expressed this finding in a simple chart:
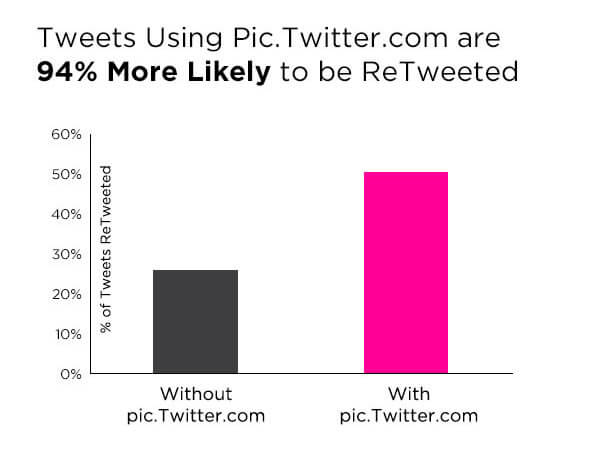
The images described by both Dan and Guy weren’t specifically science-related, but it’s clear that including such imagery can improve social engagement as well as credibility.
Science Says So…
By now, you should be convinced that adding some science will increase your content credibility.
Charts don’t lie, right?
But don’t do it because I’m telling you to… do it because science says it works!