 A few months ago, I decided to spend some time inside the Spin Sucks analytics to see if we could track and measure our blog efforts, other than the typical visitor and unique visitor increases.
What I found was something surprising. Not only can we track the normal stats, we can also pay attention to how engaged the readers are (even if they don’t comment), whether or not they’re big readers, and increases in subscribers (hi Feedblitz!).
The way to track those things are to set up goals in your analytics by time spent on site, pages visited by engaged users (in other words, not everyone, which is what Google gives you automatically), and a destination URL for your RSS and email feed.
Measure Your Blog Efforts
Are you thoroughly confused?! Don’t worry! I’m going to show you how to do it.
First, open Google analytics and make sure you have administrative rights or you won’t be able to do this.
Then change the date to January 1 through the date you’re doing this. I used January 1-May 20.
Jot down the average visit duration (ours is 1:46) and pages per visit (ours is 2.37).
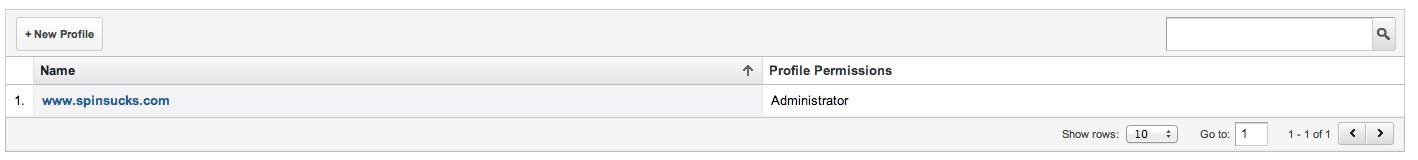
Now click on the bright orange “admin” tab in the right-hand corner. Click on the website name, which comes up under profile automatically. Then click on “goals,” which is the third tab in the next screen.
Engaged Users
Now you’re going to click “create a goal” and name the first one “engaged users.” Then click “duration” and click “next step.”
You want the duration to be greater than the average time spent – in our case it would be greater than 1:46 – then click “on” for value and add $1 (this will just give you a baseline).
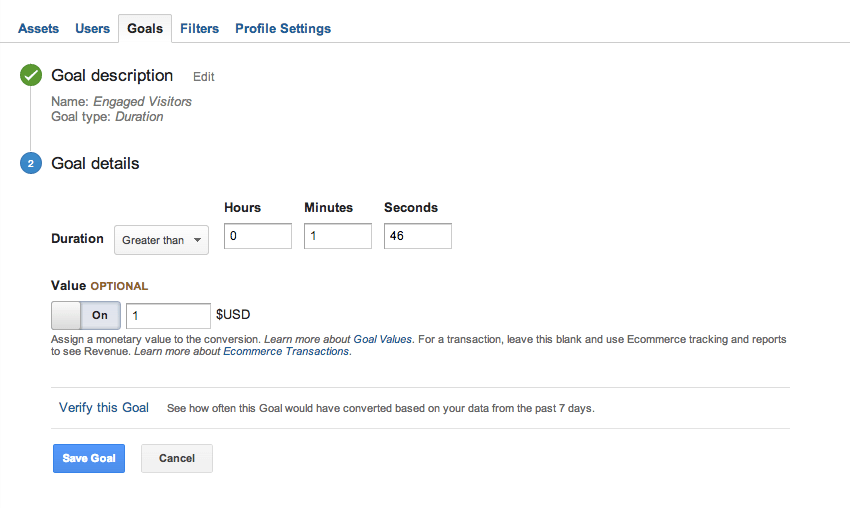
Then click “save goal” and it will begin tracking for you.
What you’re tracking is the number of people who visit your website or blog every day that spend more time with your content than the average person. It’ll take a few weeks for it to begin giving you data, but we now know about 10 percent of our visitors are highly engaged.
We can talk later about what that means and how to create specific content for those people.
Reader
Next you’ll set up a goal to track the number of visitors who review more pages than the average person.
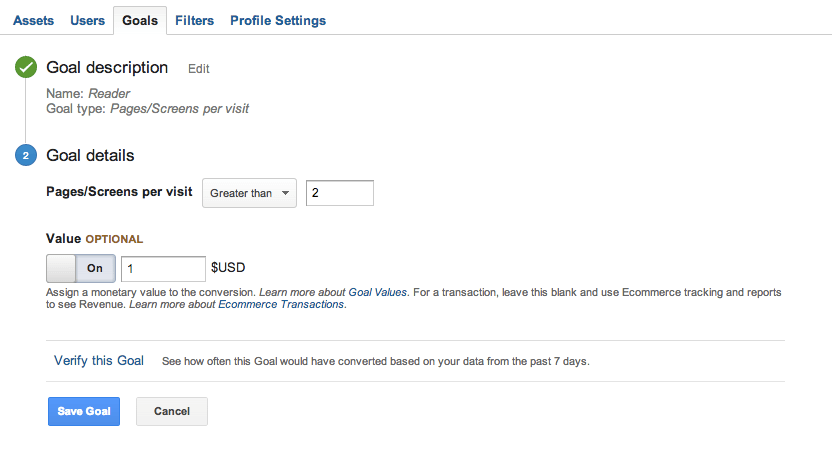
Click “create a goal” again and name this goal “reader.” Then click “pages/screens per visit” and click “next step.”
On this page, you want your goal to be greater than the average so, in our case, we’d say greater than 2.37, but it only lets you add round numbers so we did two here. We add $1 in the value and click “create goal.”
This tells you how many of your engaged readers are going to multiple pages. This is pretty important if you have a website that drives people through a decision-making funnel of content.
For instance, we have a client whose end goal is to get someone to request a quote. The funnel we push visitors through gets them to that page and, with this Reader goal, we can track who is abandoning the process before we want them to do that.
Subscriptions
The last goal we recommend is tracking how many people are subscribing to your content via email and/or your RSS feed through the site.
Of course, you can get these stats in your Feedblitz account, but why not have it set up in Google analytics so you have it all in one spot?
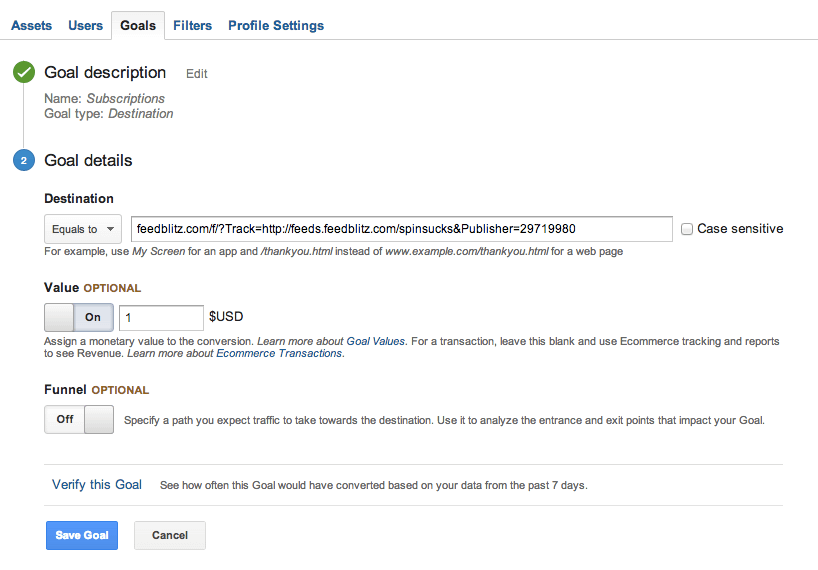
Click “create a goal” again and name this goal “subscriptions.” Then click “destination” and click “next step.”
In the destination box, paste your Feedblitz feed URL (without the http://www.), add $1 for the value, and keep the funnel turned off. Create the goal and voila!
Of course, a destination goal could be set up for nearly any URL on your site: A request-a-quote, a download, a subscription, a purchase, a shopping cart, or more. Once you’ve gone through the process, it’s pretty easy to see what others you can set up and track.
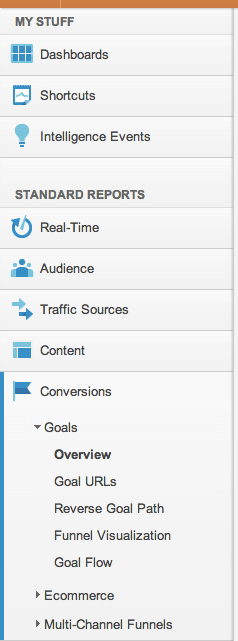
Once everything is set up, you’ll access the data by going back into your analytics and clicking “conversions” in the left-hand sidebar, “goals,” and then “overview.” All of the information is tracked there and you can view all goals together or by themselves.
Give it a week or so (it’ll happen as quickly as a day, but you want to have a few days of tracking) and come back to see what it tells you.
It’s pretty exciting and soon you’ll have smarter data that will help you make decisions specifically for your visitors and not what some blogger told you to do.
For all you PR people who say you’re not good at math? This is the data, analytics, and math you should be tracking and analyzing to measure your blog efforts. Way more fun than calculus, right?
A version of this first appeared on the Feedblitz blog.