 We all know we need to pay attention to data.
And even with the most basic set-ups—between Google Analytics, email/CRM analytics, and social analytics—we probably have more data than we know what to do with.
So while we KNOW this data has diamonds of insight in it to improve our communications plan, we often don’t practice data-driven decision-making because we just don’t have the time.
We have to finish up that email campaign, write four blog posts, finish coordinating that media interview, and polish off the presentation for our CEO (or client).
So instead we check our proverbial “data box” on our to-do list and by pulling in some data for our weekly, monthly, or quarterly reports.
Reports we often spend waaay too long on for the amount of value they provide (and attention they receive).
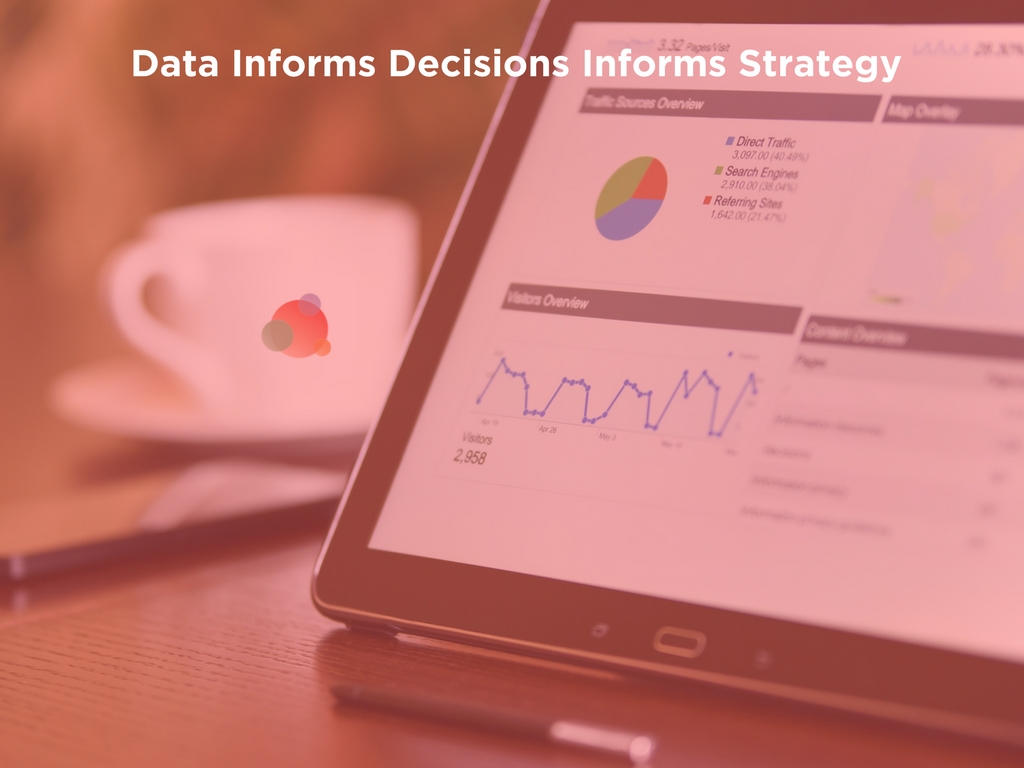
A few charts and graphs, a random stat or two, and some data points out of context to try and show things are going how we want them to (or not).
But what do these charts mean for our communications plan? Why do they even matter?
The fact is, when it comes to making strategic decisions we don’t often give data a chance to lead.
We might jump into Google analytics or our email, stare at the charts, look at some individual numbers, and call it a day.
Data-Driven Decisions vs. Data-Driven Assumptions
Instead of making data-driven decisions, when we go to build or tweak a strategy, we often do so based on what we “know” to be true from past experience, or assume to be right based on our preconceived opinions.
When we do turn to data as part of the strategic process, we don’t really practice strategic data-driven decision-making.
We practice data-driven assumption supporting.
We look at our data to confirm what we believe.
Any researcher will tell you, data has an amazing way of conforming to your beliefs if you observe it with a preconceived perspective of what it will show.
How many differing reports have you heard about whether or not bacon, wine, or chocolate are good/bad for you?
The subject (chocolate or wine) doesn’t change, but the point the individual researcher wants to prove does.
Questions Should Lead Data Analysis
That’s why you can’t approach data with assumptions. You have to approach data with questions.
Not only will this force you to use data strategically, it will drastically cut down on the amount of time you spend aimlessly wandering through numbers hoping for data to give you the answers like a Magic 8 ball.
Question-based data-driven decision-making is effective AND efficient.
Ask the Right Questions, Get the Right Answers
In general, people approach data analysis in two ways:
- Go into data blindly, hoping it will give you the answers (to questions you might not have even asked yet).
- Go into data with preconceived beliefs and look for it to prove you right.
Neither is effective.
If you’ve ever had the benefit of seeing Andy Crestodina give one of his great talks on applied analytics, you know the question –> answer –> action process of data analysis.
It’s pretty simple:
- Take an idea or goal and turn it into a question.
- Turn to data to answer the question.
- Take your answer and turn it into an action that you apply to your communications strategy.
- Measure the action and turn back to data with a follow-up question.
This process can answer questions big and small.
It can help you adjust major parts of your PR plan or simply test some messaging.
An Example of Data-Driven Decision-Making
Here’s an example of a recent data-driven decision-making process we went through for a client.
Question: Which audiences convert best on X landing page?
Process: We send people to this landing page from content, social, email, and other places on the site.
Were we looked:
First, we just wanted to get an overall sense of behavior on the landing page from different referral paths. So we went to:
Behavior → Site Content → All Pages → Landing Page X
This showed us that people stayed on the page for about two minutes (pretty good based on the page set-up) and there is an overall bounce rate of 75 percent (I’ll dig into the details of that more later).
We also see that about 50 percent of the visitors to the page go directly, while the rest come from another page on the site (“Entrance Value” is where you can determine this).
If I wanted to look just at people who land there I can go to:
Behavior → Site Content → Landing Pages→ Landing Page X
So now we want to see behavior from people coming from different sources. So we go to the “Secondary Dimension” drop-down in the top navigation and click: Acquisition → Traffic Type.
This shows me the most engaged (not the most, my goal is conversion here, not numbers) traffic is organic. Not only do they stay on site longest, it’s the lowest bounce rate and highest conversion rate.
THIS is interesting because this client hasn’t really done much to optimize organic search.
Luckily we just recently launched a PESO model plan to change that. So I’m excited to see how this data changes (hopefully for the better in both traffic number and engagement) as a result.
The next most effective channel is referral. Our referral traffic comes from a combo of partner sites and placed content. This is a huge win because it’s an important part of our current strategy.
I want to dig deeper, so I go to Secondary Dimension → Acquisition → Referral Path to see the details of specific referral sources.
One piece of contributed content, in particular, is the rockstar of this show.
The bounce rate of people coming from that piece is 20 percent, they stay on site seven minutes, and 80 percent of them convert! Eighty percent.
I made a note for myself to look at that piece and determine some other ways we can repurpose it as well as key messages to we can pull and test elsewhere.
I also note to look for other opportunities with that publication. This is our audience.
I go back to Source to continue evaluating our source referrals.
Social hasn’t referred many people, but those that have are converting and highly engaged.
We recently adjusted our social strategy to speak more effectively to the audience this page is aiming to convert (a change based on a previous data question-answer session like this one), so this insight makes me happy.
If I look at historical trends, I can see when the change in strategy and how it’s exponentially affected this data point.
Now for the bad news, it appears we aren’t converting people from email. This *should* be an engaged channel, but it’s bombing big time. I need to combine this data with our CRM analytics to find out more.
Analysis Into Action
Whew, ok….lots of stuff there, but I’m not done yet. I’ve confirmed some things, given myself some action steps to optimize our current plans, and have a few areas I need to dig deeper.
My next step also is to look at the people who are coming to the page as a landing page and those who come there from another page on our site.
I do this by going to Behavior–> Behavior Flow (where I see the flow from home page to landing page) and then digging into the numbers in Behavior → Site Content → Landing Pages –> Home Page.
What I find here is that people who hit the home page first and then go to the landing page convert at a higher rate. Not at all what I would have expected. But that gives us some interesting insight to test a few things with, including the calls-to-action and the landing page copy.
Now I have a list of action steps to work on and measure, so I can make more data-driven decisions.
Modern Communication Demands Data-Driven Marketing
Data-driven decision-making is a very different process than using data to observe trends. But one modern communicators cannot live without.
Don’t let yourself get overwhelmed. Schedule an hour at the end of each week with the goal of answering questions.
Stop at the end of your hour and make an action list of how you will apply your learnings.
If you want to talk more about this topic join me and Jen Zingsheim Phillips, director of marketing communications with CARMA, for “Insight and Action: Making Your Data Work for You.” on Thursday, April 26th at 2pm EST.
We will dig into these issues and more. And we’ll provide more actionable tips on how to integrate data-driven decision-making into your communications plan.
Until then, just say no to meaningless charts. Just say yes to strategic data-driven marketing.
How do you integrate data-driven decisions into your work?