 We’re back! It’s been quite a ride digging into the depths of the Data Lifecycle.
Overall, the goal has been to outline how you can make better use of data, how to think about managing data, how to think about processing it, and the cycle you should go through with your data to make it more useful.
We have covered the first two phases: Preparation and Exploration.
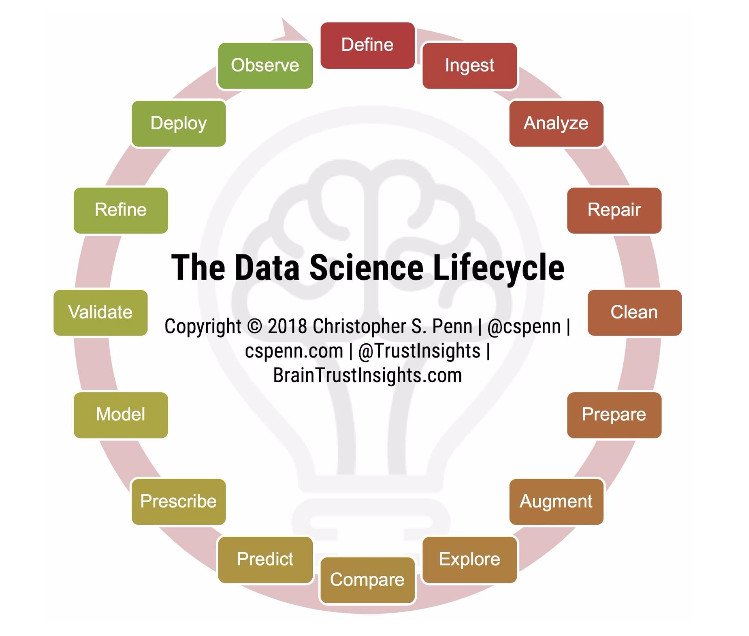
Welcome to phase three: Production.
The Production phase of the Data Lifecycle covers the Prescribe to Observe stages. That seems like a lot, right? So let’s get going!
Data Lifecycle: Prescribe
Okay, we’ve got our predictions. What prescriptions can we build from them?
Let’s say I know women’s gold pumps will be very popular during the third week in November. I can prescribe a recommendation based on that.
So in this case, I want you to double your AdWords budget for the search keyword “women’s gold pumps.”
And to this, we can apply driver analysis. This is where I find out that tweets and emails combined on the same day are the things causing the highest number of conversions.
Now, I have a prescription: Double the number of tweets and let’s see if there is a corresponding increase in that KPI.
That’s the process of building a prescription.
Data Lifecycle: Model
Once we have our prescriptions written for all these different types of analysis, we have essentially built a model.
We have identified a mathematical relationship between these things. And we’ve created these prescriptions.
Now, we’ll codify it into a model and then test it.
Data Lifecycle: Validate
This is the validation stage.
If we think tweets on Tuesdays are the most important thing, that’s great; we’re going to tweet a lot more on Tuesdays.
We are going to validate the model and prove or disprove the prediction.
The prediction is the hypothesis.
Now, if you remember your science classes—assuming you didn’t sleep through them—when we test a hypothesis, we test whether it’s true or false.
And so, no matter what we’re doing, whether it’s driver analysis or time series forecasting, we want to understand if our prediction is causative.
This goes back to one of the core axioms of statistics: Correlation is not causation.
Just because something has a mathematical model—the relationship we saw in the prediction phase—does not mean it has a causative relationship.
This is why validation is so important.
We can’t just say, “yes, tweets drive this thing,” so we’re just going to tweet more, and everything will be great.
We don’t know this for sure. So we have to test.
There is a textbook example which many people provide to help understand the difference between correlation and causation.
For instance, you look at a chart, and over time you see the number of people who die from drowning goes up, and the number of people who eat ice cream goes up.
Now, if correlation is causation, then clearly, ice cream causes drowning.
But we know that’s not true.
From a common-sense perspective, we know that during certain times of the year it’s warmer than other times the year.
People will eat more ice cream when it’s warm and will swim more when it’s warm.
As a result, unfortunately, with more swimming, there will be a certain percentage of people who drown.
And so we understand that this is a case where there is no causation.
We know that if we were to increase or decrease the amount of ice cream people ate, we would not see a change in drowning deaths.
Likewise, with a lot of our marketing, a lot of our PR, a lot of our communications metrics, we need to prove that the mathematical relationship actually matters.
So, if we see emails driving more store visits, that’s cool. We’ve established a relationship. Now let’s send 50 percent more email.
But does the number of store visits also rise by 50 percent?
If the answer is yes, then we have established a causative relationship.
This is the validation phase.
If the answer is no, then we know we have a relationship we need to dig deeper into.
We need to go back to the drawing board and say, “Okay, well, they’re related, but we’re missing something.”
Kind of like the ice cream and drowning example: You’re missing the season. You’re missing the temperature outside.There is data that is missing.
So, if you increase the amount of email you send, for example, and your leads don’t go up, then you’re missing something.
Go back to the beginning and figure out what data you’re missing.
Data Lifecycle: Refine
If we do find there is a causative relationship, that’s when we refine the model.
Bring in more variables. Remove variables. Test greater than a certain amount, less than a certain amount.
We want to explore the limits and the boundaries of the causative relationship we have found.
This is the Refine stage of the data lifecycle. We need to understand the relationship.
If we send 20 percent more emails and get 20 percent more lift and leads, or if we send 50 percent and only get 30 percent more leads, we need to be able to explain that to people.
Data Lifecycle: Deploy
We’ve done the work to create a model, validate and prove that it works, and refine it.
Now, we’re ready to deploy and roll it out to the rest of our team, our agency, or our in-house brand team.
Deploying is about making it production-ready and getting it ready for business users.
Much of what we’ve talked about so far is very much work that data analysts, data scientists, and marketing technologists would be doing.
We want to figure out how we take this and turn it into something that’s usable for everybody, from intern to CEO, who is deploying the model.
Data Lifecycle: Observe
After the model is fully deployed and everyone is sending 50 percent more email (because we know that’s working), then we observe.
We look for unusual behavior that indicates, yep, this is working or no, something’s different, something’s changed.
We’re sending more email. We’re sending 20 or 50 percent more tweets on Tuesdays, and suddenly, the response rate isn’t as good as it used to be.
Anyone who’s done any kind of marketing on Facebook has seen this scenario play out a lot.
“Hey, we’re doing our thing on Facebook and… whoa! Our reach is gone.”
Something changed. So we observe.
And that brings us back to the beginning of the process where we have to (re)define our goals.
We want reach on Facebook, but our numbers dropped off. What’s going on? It begins the lifecycle all over again.
This lifecycle is how you get to prove answers when you’re working with your data.
It applies to any form of data you’re working with—quantitative data, certainly, data that is measured, and numbers and percentages.
It also applies to qualitative data to some degree, but with a little bit of refinement. Particularly with regard to modeling and deployment.
Data Lifecycle: Don’t be Intimidated
Do you find it intimidating reading all of this?
Well yes, it can be, especially because there’s a fair number of people who chose communications because math was not their strong suit.
But the reality is, today, everybody has to be able to do everything, at least in some capacity.
The folks in the marketing technology community call this a “T-shaped person.” Someone who has a lot of experience across a broad area, and one area of deep expertise.
The latest trend has been what’s called—perhaps inappropriately—a “Fat T” or “Wide T,” where, guess what? You can’t be specialized in one thing to a super narrow degree.
You need to have multiple specialties or broad, deep experience.
Although it’s neurologically unsound, the analogy of a left-brain person versus a right-brain person—someone who is quantitative versus creative—is still an apt analogy for saying you can’t be left- or right-brain anymore, you have to be WHOLE brain.
Or, you have to hire enough people to compensate for where you aren’t as strong.
So if you’re not strong with data, guess what? You’ll need to hire a data person or data agency to do much of the data work while you focus on the creative.
And that’s okay. It’s okay if you are mid-career and know that you don’t want to go back and learn statistics again, or try and pick up machine learning.
But understand, you will need to have that capability, either in-house or agency-side, in order to make the most of the data lifecycle.
At the very least, if you take nothing else from this, understand that you need to be looking at your data. You need to be exploring it.
The Explore phase, and understanding what’s in your data is the linchpin to everything else in the data lifecycle.
Because, yes, that whole first process where you’re starting to formally clean and prepare the data…if you’re just getting a single export file out of Google Analytics, there isn’t much preparation to do.
Likewise, building prescriptions and stuff from the other side. And modeling. If you’ve got a small amount of data, you may not necessarily need to dig deep into every aspect of the process.
You would need to do this at the enterprise level, but for a single person, a solo practitioner working with one narrow set of data, you don’t need to follow the formal steps in a such a rigid process that doesn’t allow you to be creative.
That said, the exploration, compare, and predict pieces at the bottom of this model are the most important skills to pick up.
They will tell you, anytime someone gives you a piece of a data set, “Okay, what’s in here? Let me get some context for it. And let me build something from it.”
Those three skills are the ones you need to develop.
Data Lifecycle: What Now?
Now, the logical question is, okay, if I need to learn those first, how do I do that? Where do I start?
You could take a data science course.
And if you have that aptitude, I would strongly encourage you to pursue this because it’s a very valuable skill set.
But if you don’t have that aptitude, then hire someone who does.
You need to have that capability—the built-in analysis capacity—in order to make use of all the data every industry and every profession is dealing with.
Data Lifecycle: Curious?
Another attribute not listed here, but encompassing all this on a mental level, is curiosity.
If you are not a curious person, if your client is not a curious person, if your CEO or your board are not curious people, none of this will matter.
You need to have the desire to know more, to want to explain things—and really explain them, not just a five-second answer or bullet on the slide—and ask questions like, “Why does this happen? What made this happen? How can we make this better?”
If you don’t have that curiosity, you’ll go out of business.
If you work for incurious people, update your LinkedIn profile and start looking, because that’s a company which isn’t going to make a commitment to data.
And they certainly won’t make a commitment to data science or machine learning.
The way the world and industry are going, those companies which are curious, willing to test an experiment and be a little further ahead, and are willing to fail at various projects, they’ll be the ones who make bank.
They are the ones who will develop a competitive advantage so strong that it is so far ahead. They are the early adopters who will develop an insurmountable lead.
For example, if you look at Google or Facebook, or any of these behemoths: They have nearly insurmountable leads.
The only thing that will bring them down is themselves.
Data is an Asset
The same will be true in every industry. The company that embraces data and the data lifecycle across the board is going to have a nearly insurmountable advantage.
Because, as we were talking about at the very beginning, data itself is an asset.
Once you build models around it, once you build systems around it, that becomes valuable in and of itself.
The sooner you start, the more data you accumulate. Particularly when you perform the cleaning process during the first part of the lifecycle.
And this means you have better models, and that means you have better assets. It means you have a headstart on someone coming along later.
They have to catch up, and may not be able to, because you’ve got all the data from the time period before they got in the game.
So the sooner you get on board and get it in place, the better your company is going to perform.
Well, that was a lot to take in! Three posts on data and the data lifecycle is a lot to think about and consider.
But this is part of the future of public relations. Although, it’s not the whole future.
Again, left-brain and right-brain. Creativity is not going away. Empathy is not going away. Human judgment is not going away. Human and life experience is not going away.
And the relationships you build with your media sources, with your clients, with influencers, those aren’t going away either.
But if you only have half the pieces and your competitor has them all—qualitative and quantitative—that competitor is going to win.
So, you must have all the pieces!
Data Lifecycle: The End?
I hope I’ve been able to cover any and all aspects of data, data collection, data modeling, and, ultimately, how you use data.
We’ve packaged this into three webinars for your viewing pleasure:
Part 3 of the Data Lifecycle for Communicators: Production
Don’t forget to check out the first two parts of the Data Lifecycle series if you missed them:
Part 1 of the Data Lifecycle for Communicators: Preparation
Part 2 of the Data Lifecycle for Communicators: Exploration
I look forward to taking your questions if you have any.
Please feel free to ask below in the comments, or join the Spin Sucks Community and connect with me there!
Also, if you want help with your company’s data and analytics, visit Trust Insights and let us know how we can help you.