
The last piece of an integrated PESO Model program is measurement, which is a three-part series, in and of itself, because this is not an easy topic to tackle, nor implement.
If you’ve missed the previous articles, you can find them here:
- What Is the PESO Model?
- The PESO Model: Does Paid Media Belong With Communicators?
- The PESO Model: Where and How Earned Media Fits In
- The PESO Model: Bringing Shared Media Into the Mix
- The PESO Model: Start with Owned Media
- The PESO Model: Bringing It Together with Thought Leadership
- The PESO Model: How to Measure Your Efforts (I)
Measuring Your PESO Model Efforts
Now that you have an idea of what to measure for both brand awareness and sales in the PESO Model, it’s time to dig into how you will use that information to prove your own worth.
During the earned media section of this series, you created your benchmarks, so you already know where you started. Now it’s time to measure PESO Model results!
At a high level, your metrics are going to be as simple as:
- Your domain authority has increased; and
- You’re ranking on the first page of Google for your topic.
If you hit these two out of the park, everyone will be happy. When people search for your keywords, you’re there. When people are looking for a solution that your organization solves, they find you.
They see you on the first page of Google results, they click on your amazingly compelling headline, they visit your site, they fill out a lead form, they go through your lead nurture process, and they become a customer.
Hooray!
A B2B Example
But domain authority and search results are just the beginning of how to measure PESO Model results. Ideally, you want to show conversions from website visitors to customers.
Let me give you an example.
We have a client that is a business-to-business manufacturing organization. It’s not a super sexy business, but we’ve been able to have a tremendous effect on their bottom line and help them reach new audiences through contributed content. And I love them for that reason.
We worked with Cincinnati media outlets for more than a year, in support of a new facility they opened there. We had a few phases, including pitching interviews, contributed content on third-party sites, and ghostwriting content for the CEO on the company’s blog.
The PESO Model campaign was around:
- Their negotiations with the city
- The groundbreaking for the new facility
- Hiring in advance of the grand opening
- The ribbon-cutting ceremony
This is not exciting content by any stretch of the imagination, but it was very, very useful for them.
Measure PESO Model Results
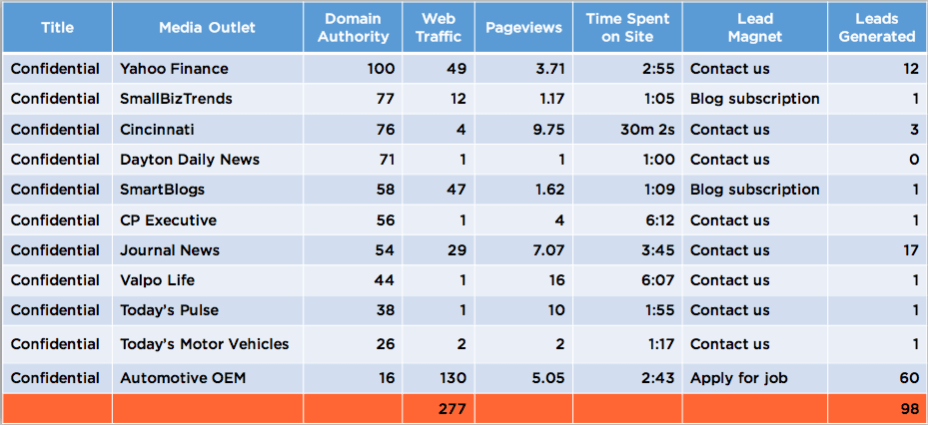
To track results, I created a quick spreadsheet, listing all of the places the client was mentioned during the plant launch and opening. Quickly scanning the list, I can see the SmartBlogs entry was a piece of contributed content from the CEO.
Their domain authority is 58, which is higher than the company’s blog. That piece sent 47 visitors, who spent an average of one minute and nine seconds on the site. The call-to-action on that piece was to subscribe to the blog, and you can see that the piece generated one blog subscription.
One subscription from 47 visitors isn’t a great conversion rate, but it gives us something to use in our second piece of contributed content.
As you can see, the more content we produced, the better the conversion rate. We had about a 35 percent conversion rate and return-on-investment for our contributed content, bringing 277 new visitors to the site with 98 leads generated.
This means people did something on the site such as apply for a job, subscribe to the blog, or contact the company through their contact form.
What to Track When You Measure Results
This is how you start to measure your PESO Model results. You track all the places you are placing content, and the resulting traffic to your website, and the conversion of those from visitors to potential clients.
You want to track activities such as:
- Subscribing to your newsletter
- Downloading a white paper
- Watching a video
- Registering for a webinar
- Submitting a job application
- Any other call-to-action you are using on your website
This can be any action that you can track. You’ll note we stopped at the point the visitor is converting into a lead.
With this particular client, moving a lead into a closed sale is the job of the sales team, which is pretty typical.
But if you can prove a new customer began with your work, you’ve won.
Of those 60 people who applied for jobs with our client, we don’t know how many of them were offered a job. What we do know is 10 percent of their qualified leads turn into customers. We can use that on our end to measure results and show a return-on-investment.
Why Links in Articles Are Important
If there were 30 customer leads, 10 percent conversion is three customers. And, if their typical customer generates $250,000 per year in revenue, that means our efforts can be attributed to $750,000 of revenue, which is a pretty great return on their monthly PR retainer investment.
Of course, this is only directional, but it’s a start at showing the direct business value of the work we’re doing.
Let’s dig into how you get these numbers. Here’s an example of one of the articles in the Cincinnati Enquirer.
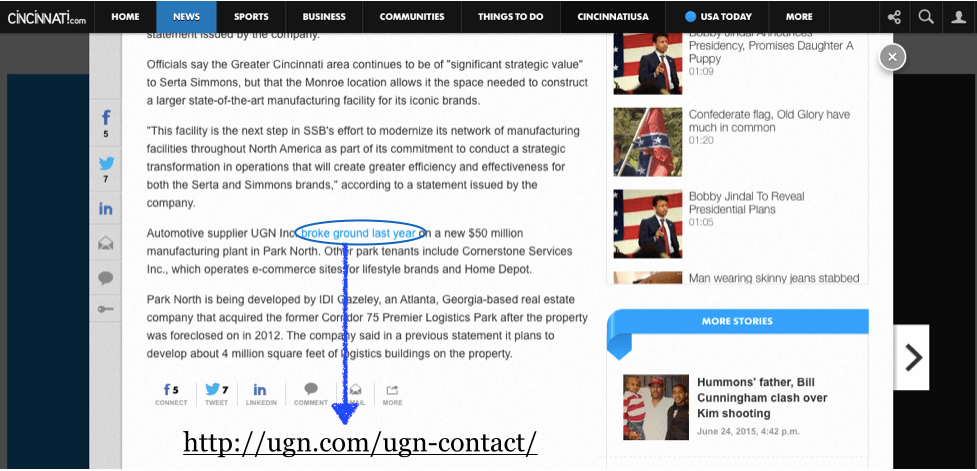
The anchor text you see here in blue was linked directly to the company’s contact form. We specifically chose to use “broke ground last year” as our anchor copy because we knew people would be searching for plants in Ohio that had recently broken ground if they were looking for a job in manufacturing. And, because our objective was driving job applicants, that’s who we wanted to attract.
Here’s the form that the site linked to.
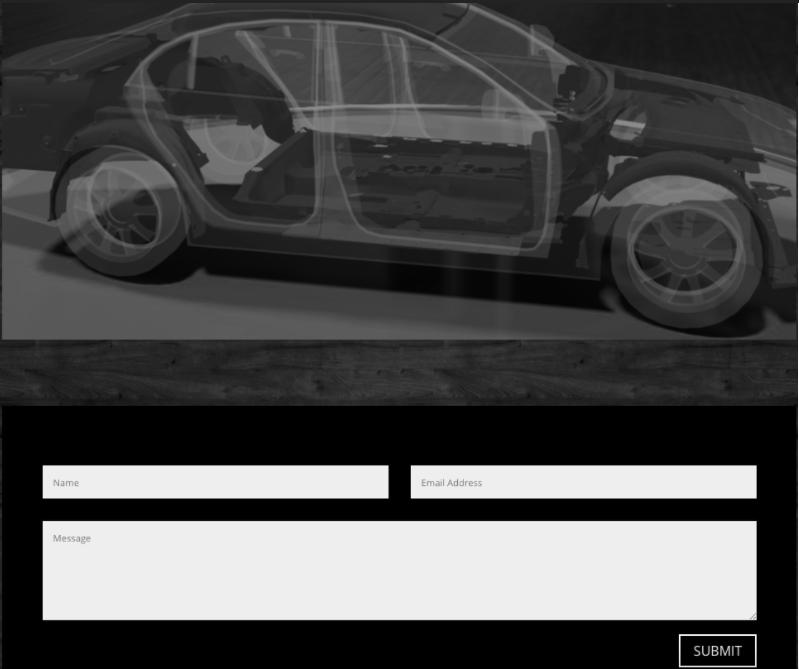
As you can see it’s pretty simple and doesn’t ask for a ton of information. It just acts as a conduit for communicating with the company from their website. Submitting this form is the call-to-action.
A SaaS Example
As you start placing contributed content and seeding it with your trackable links to your website, you can begin to measure PESO Model results.
This example is data from a different client. I have removed incriminating information, so you can see an example of real results without breaking their confidentiality.
In the tracker, we log:
- The date of the article
- The title
- The publication name
- Their domain authority
- How many visitors the piece sent to the website
- How many pages they viewed per session
- The amount of time they spent on the website.
You can track this data manually in a simple spreadsheet, or you can move into a more sophisticated automated tool. We like DashMetrics, Domo, Geckoboard, or Raven SEO tools.
Steps to Measure Results from Analytics
To get the data you need to populate this tracker, log into Google analytics.
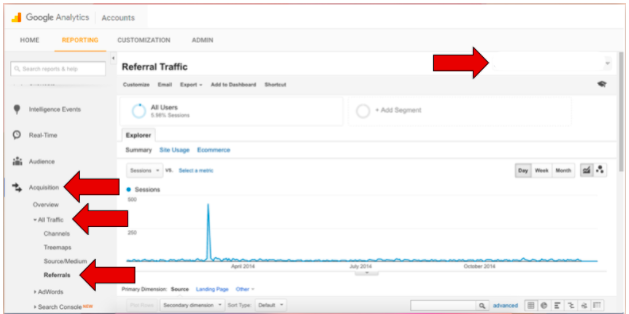
Choose the desired date range at the top of the page— I chose Jan 1, 2014-December 31, 2014 because that’s when we started working with the SaaS client above. Then click on Acquisition in the left-hand navigation to expand that menu, then on All Traffic, and then on Referrals.
This will bring up a search bar. In this search bar, input each of the domain names for the publications where you’ve placed articles and search for them.
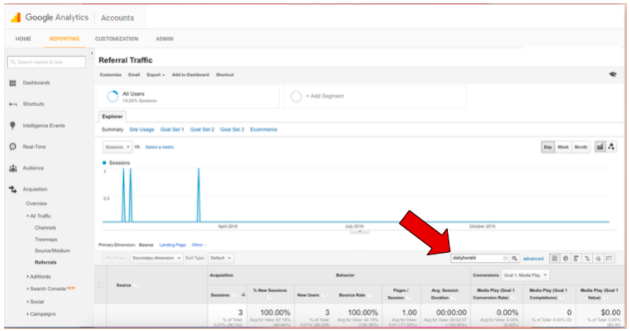
For example, for the Chicago Daily Herald piece we placed, I’m going to type in “dailyherald” and hit the search icon to return the data on the referrals from that domain.
It’s important to make sure to use the media outlet’s URL and not their name.
Google Analytics tracks the referring URLs and not the names of the websites that refer traffic to you.
Make Better Recommendations
When I hit return on my dailyherald search, here’s what I see.
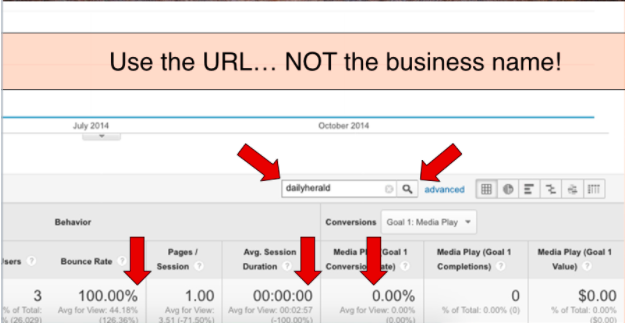
In 2014, the Daily Herald website sent this website three visitors, all of the new users, but the bounce rate was 100 percent. That means that every one of the visitors came to the site, didn’t find what they were looking for or didn’t find the content interesting enough, and left without viewing any other pages on the website.
In this case, it’s not a good return-on-investment. The lesson here is, although the client was interested in local publications, and that’s where we worked to get placements, those stories—here and with Crains and the NBC Chicago affiliate—did not generate website visitors.
These placements might make the client feel good when their friends and family excitedly tell them they saw the mention, but it’s not doing anything for them—it’s not driving business results.
That means it’s time to consider revising this strategy. With the data in front of us, it’s easy to recommend focusing on KMWorld, VentureBeat, Forbes, CMSwire, and TechCrunch.
In this example, we have the publication name, the number of visitors, the number of conversions, and the revenue generated by those conversions.
Back Into the Conversion, If Need Be
For this client, their conversion rate is 1.35 percent. Using Forbes as an example, we take the number of visitors, 209, multiplied by 1.35 percent, which would give us three as our number of conversions.
Next, we take the number of conversions, three, multiplied by the typical revenue per conversion, which is about $21.39, which gives us revenue of $64.18 for that Fortune placement.
TechCrunch sent more than 10,000 visitors to the site and accounts for about half of all the revenue generated for the year from these placements. That context makes it pretty easy to decide where to double-up your efforts. It also gives you the ability to show that your efforts are directly responsible for generating revenue—it’s not just an expense.
While $7,000 in revenue doesn’t pay for all the time you spent on communications for the year, it’s better than $0, and it gives you a starting point to measure PESO Model results.
Many tech vendors call this PR attribution—check out what both Onclusive and TrendKite are doing around this. It’s time to gain proper credit where it is due.
PESO Model Certification
Do you want to learn how to build and scale an integrated communications program? One which drives real business results and shows the PR value clients care about?
Do you want to stand out to clients and employers, grow your agency or organization, and lead the communications industry
Learn how you can become PESO Model Certified today.